Free
Build the perfect data set in minutes.
$0
USD/ month
It's amazing how many different data sets come our way. Tracking
where they are, the scope and whether they include the latest can
be a time consuming process.
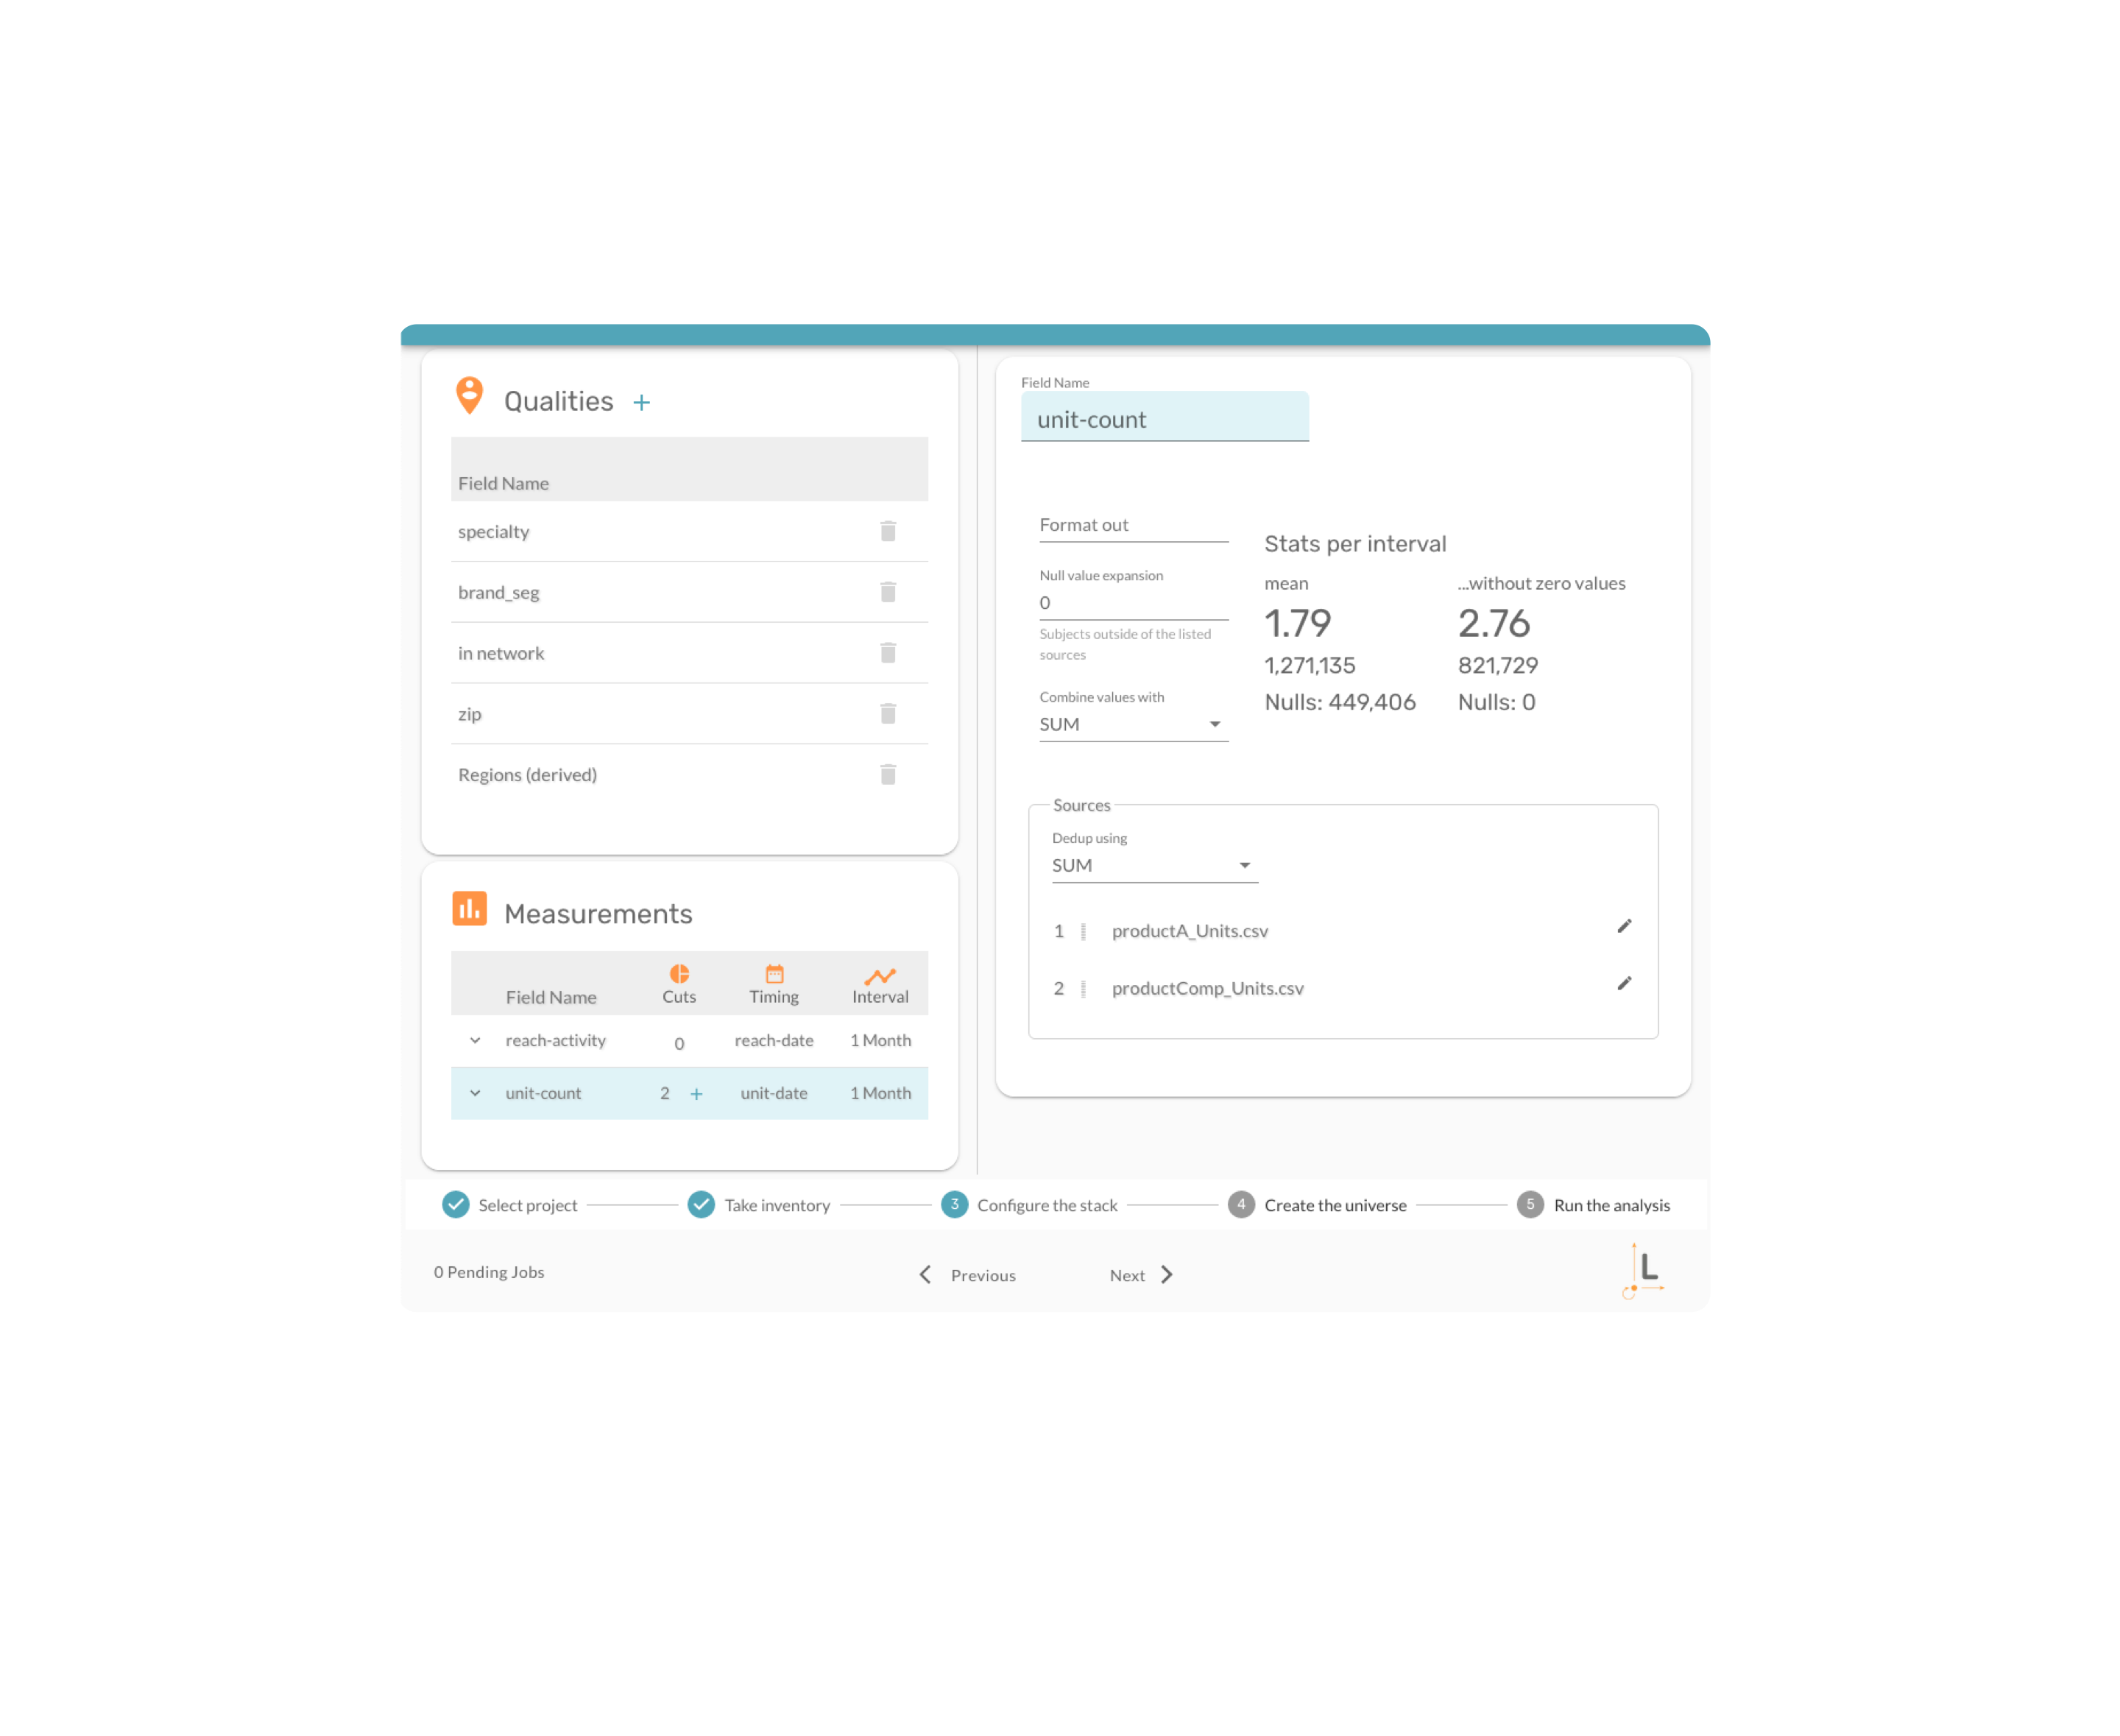
Take inventory of the data anywhere in your drive, shared-drive,
corporate data centers and the cloud. A permanent inventory of
data sources is built-in to the process.
The source data is never changed ensuring a complete record of
your process from start to finish.
Who knew that naming fields could be so time consuming and prone
to error. The process reduces the complexity of this often
tedious and time consuming task through a combination of approaches.
The process leverages the inherent qualities of the data and the
information therein to inform and reduce the burden of tracking the
otherwise fragmented single field perspective.
Interprets and validates how all of the data "fits-together", instantly. Provides ongoing, real-time feedback and next-steps.
The result is a fully automated and reproducible process. The end-result is palpable: confidence, consistent treatment of related fields.
No more need to generate and manage scripts with how to combine the data sets. Easily specify and change how data is being combined.
The workflow for accomplishing the task is optimized in several ways.
Never again rely on stale computations to avoid introducing
inconsistencies.
Pull from a range of well-known computations (e.g., market share,
customer decile)... and less-well-known but really useful if it
weren't so complex before now.
Create your own integrated computations for you and your
organization to leverage, anytime.
Avoid introducing differences that are external to the subject
universe. Specify the subject universe once. All of the computed
fields will be computed consistently using that single universe.
Create a time-series, or perform any number of data
transformations with one end in mind: a data set structured for
statistical analysis.
It's one thing to compare two groups, it's a whole other thing to compare two groups for purposes of statistical comparison. Build test and control groups leveraging the industry gold-standard.
Visualizing the data is core to ensuring a valid comparison. However, the task can be made near impossible when the "main-effect" occurs at different points in time for a given subject. No more. The platform allows for absolute and relative time; either-way, the derived fields for the test and control groups will be correct and always computed based on the latest iteration.
When you get updated data, no problem. The fully-automated process makes it easy to integrate and iterate with confidence. Integrate a new dataset that might explain some of the variance (i.e., something that might reduce the noise to help see more of the signal).
The application is built for collaboration making it easy to share, and iterate on both the design and details of the data.
Review and share your approach with a colleague. The configuration
is ready and available anytime.
Leverage the methodology for the next study anytime.
Control what is shared when. Managing data access and
licensing can all be controlled for this single point to control.
In the event there is even more you want to accomplish, or need to
use the data to feed another data pipeline, we have you
covered. Once you have structured your data, the data
is stored in a format that can be used anywhere.